Environment
-
gvmd: 26.19.0
-
GSA: 26.14.0
-
PostgreSQL: 17.9
-
Docker deployment
-
Database revision: 272
The installation was upgraded from an gvmd 22.4 several months ago.
Problem
Hello. I’ve got a problem. As soon as the Reports page is opened, PostgreSQL starts executing one very expensive aggregate query, trying to load the Reports with High Results chart. While this query is still running, the browser eventually retries the request, and more identical queries are started. Finally, 10-15 PostgreSQL backend processes appear, all consuming CPU.
On a 16-core server this drives PostgreSQL CPU usage close to 100%.
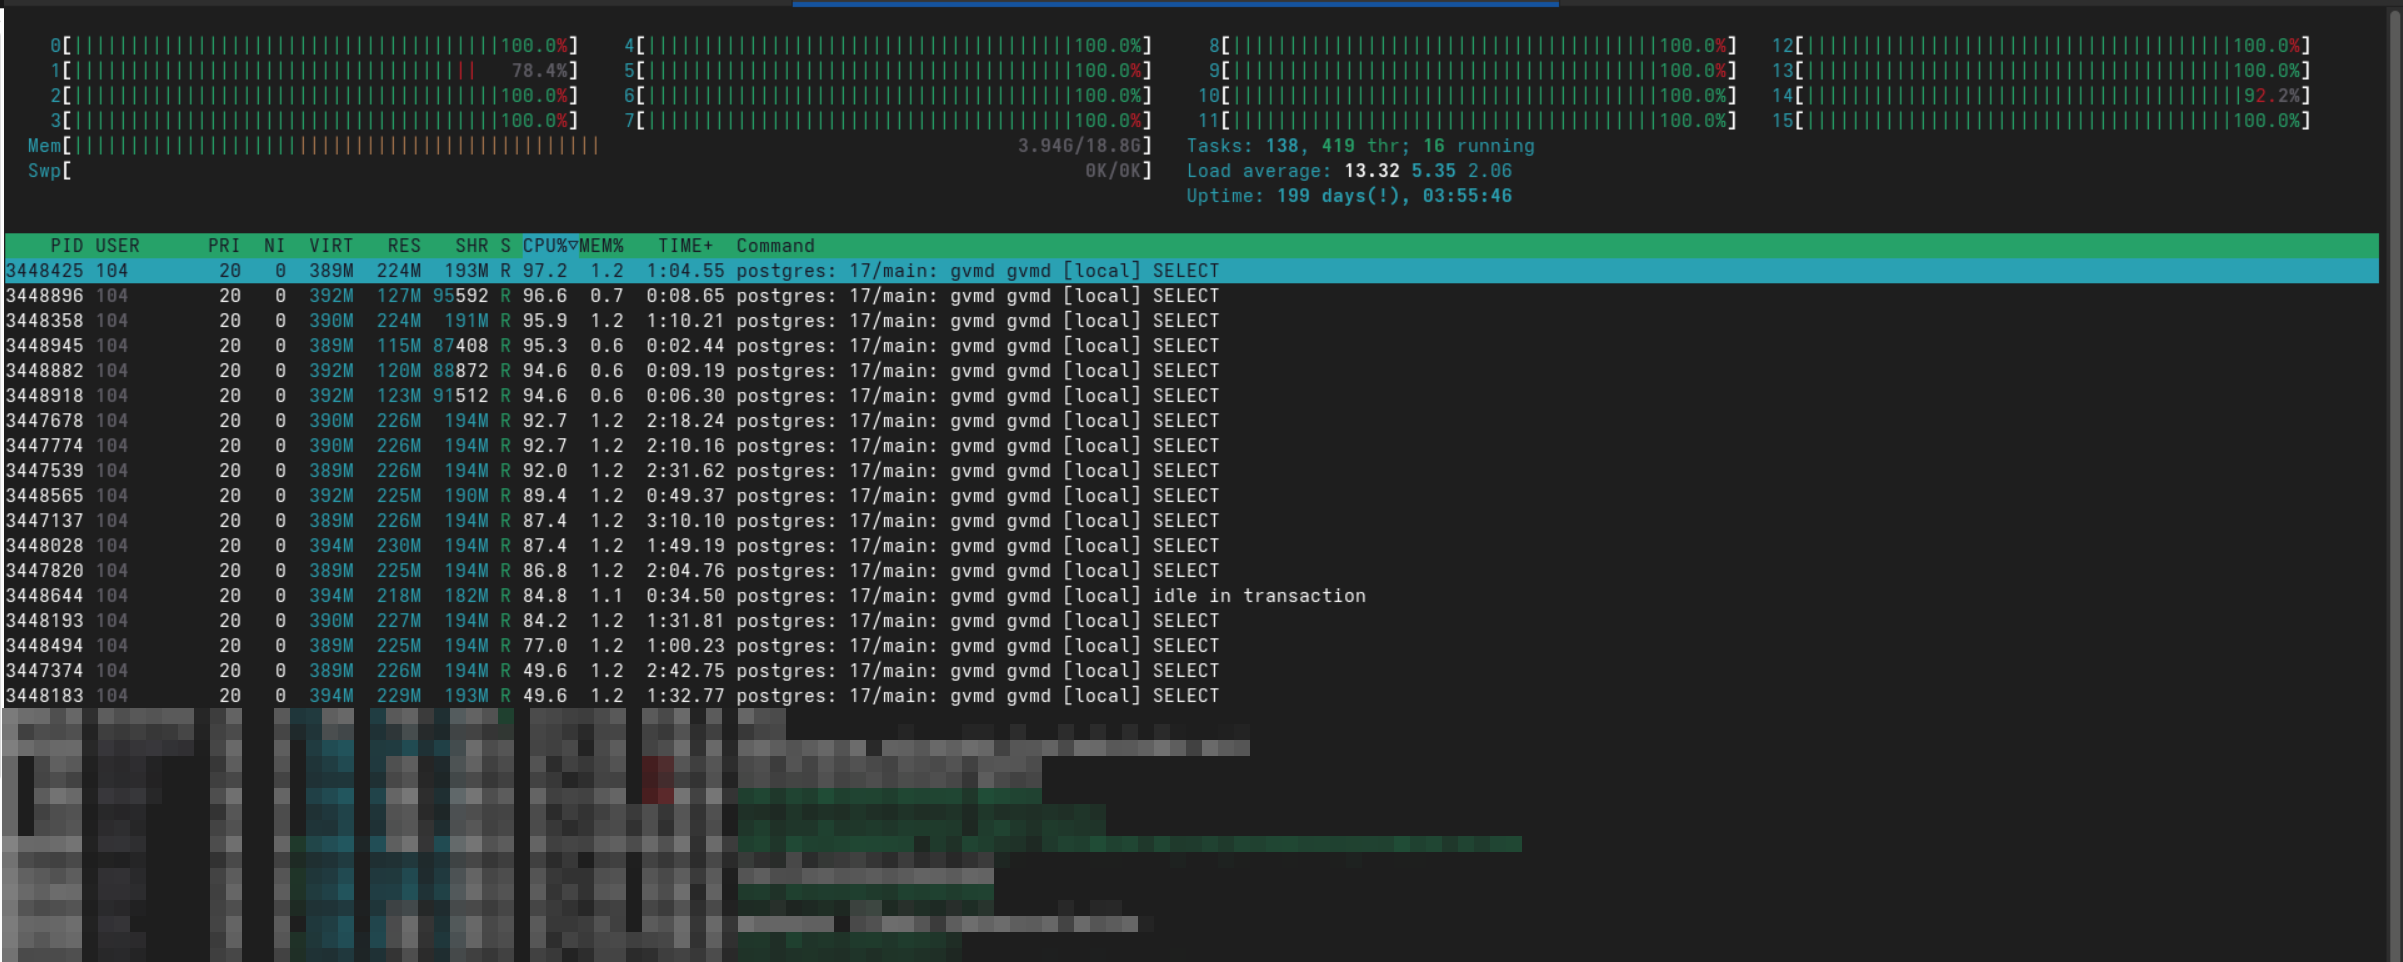
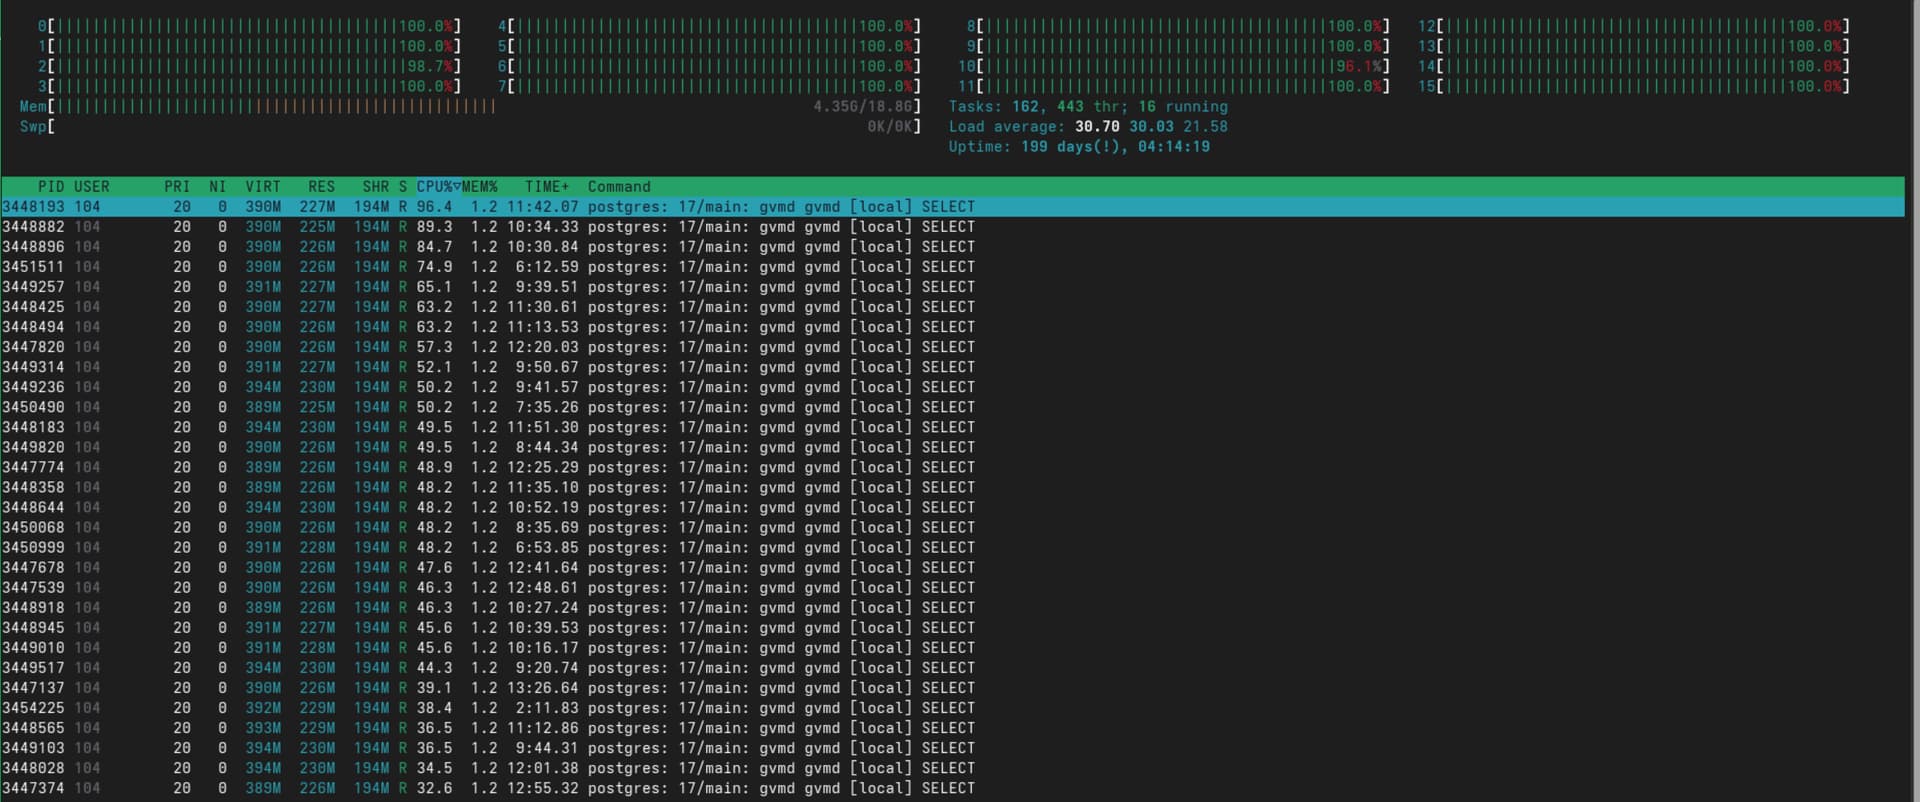
Observations
The problem appears to be caused specifically by the default chart:
Reports with High Results
The other two charts (Reports by Severity Class, Reports by CVSS).
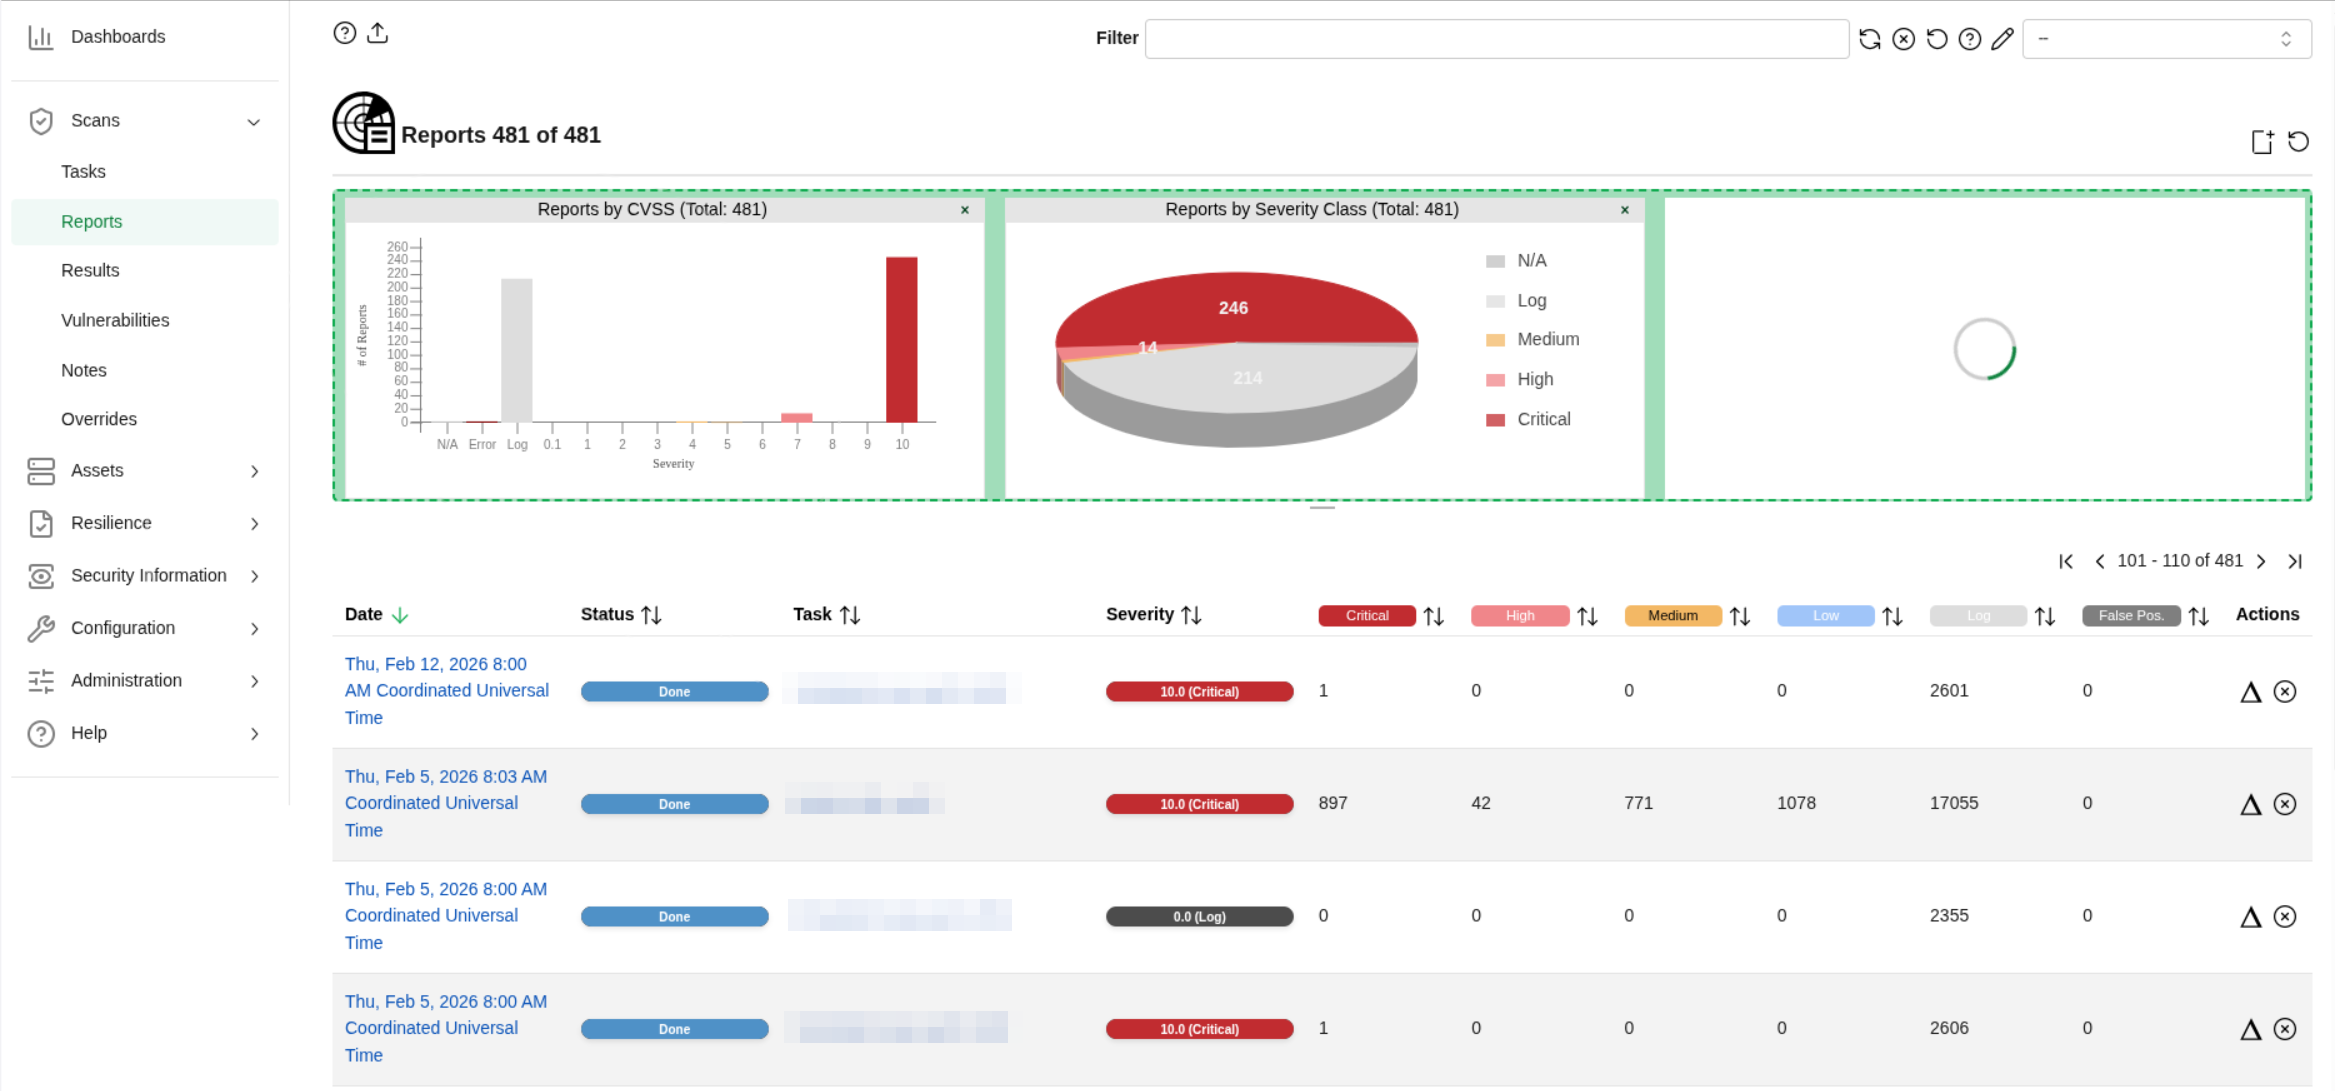
If the “Reports with High Results” chart is hidden (once it manages to render), the issue does not occur. This strongly suggests that the expensive query belongs only to this chart.
Database statistics
reports               : 493
results               : 1,489,570
report_hosts          : 1,094,734
report_host_details   : 6,385,800
Vacuum / Analyze
Autovacuum is working.
Manual VACUUM ANALYZE was also executed.
It did not change the behavior.
Reports state
Most reports are finished.
Done        : 484
Stopped     : 7
Interrupted : 2
I don’t understand why the resulting SQL is so expensive 
Sure, I can just disable the problematic chart, but I can only do this for one user and I can’t change the default view.