This is my first attempt to use OpenVAS: I’m trying to use Community Edition (in Containers) to “Full and fast” scan an embedded device that regularly crashes during the scan.
The result are 5 “NVT timed out during scan” in report and 10 to 11 quite general log messages, but nothing else, even though thousands of HTTP requests and more have been made (and answered).
In one rare case the device was reachable and alive after the scan, but still the report says just the same - timeout, error, nothing else.
Shouldn’t it report about all the tests made until a timeout occured, even if a family of tests had been interrupted due to a crashing target? I’d expect at least some words telling me about the thousands of requests that have been made until then.
You can find this information in the logs. Search the forum, there are already some discussions on how to enable various levels of logging for VT execution and progress tracking. This post indicates how to pass settings to openvas.conf for Docker containers.
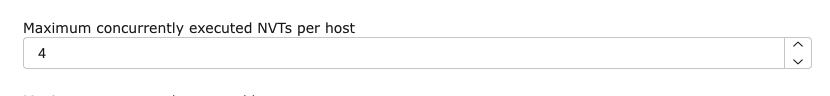
Furthermore, have you adjusted the scan task to reduce the number of concurrent VTs executed on the target? The default is 4, you could reduce to 1.
If you want to set a global timeout for VTs**, it’s set before starting openvas-scanner using the plugins_timeout option. The issue is discussed here.
Ah, by “10 to 11 log messages” I referred to the results with level “0.0 (log)” in the report, not what the actual “logs” deliver. Sorry for the wrong term. There are just these very generic “results” (the device has a very basic TELNET and HTTP service for status output purposes), not mentioned all the other work done.
Services 0.0 (Log) 23/tcp
Services 0.0 (Log) 80/tcp
Telnet Banner Reporting 0.0 (Log) 23/tcp
OS Detection Consolidation and Reporting 0.0 (Log) general/tcp
Traceroute 0.0 (Log) general/tcp
HTTP Security Headers Detection 0.0 (Log) 80/tcp
Web Application Scanning Consolidation/Info Reporting 0.0 (Log) 80/tcp
I am aware that is what you are referring to. I’m directing you to the system logs because you want to know about:
But this is not tracked in the web-interface report. A complete log of all VT execution and time required per VT requires the system-level logs. If you read the first post I linked it says:
Yes, I can see the thouands of requests in the logs, and to reduce the chance of crash I reduced concurrent VTs to 1, configured a delay between them, and tried to deselect execution whole families of VTs. But my issue and question here is not about the logging nor crash but:
Shouldn’t all that make a difference in the report? It doesn’t, As I experience it, no matter how much VTs were executed, the log just contains those “VT timeout after 1200s” info.
I have no idea what IoT device you are scanning, how it is configured, or anything else about it. So, it is not able to predict these things about your infrastructure.
Why “predict”? I expected some kind of summary in the report like at least one line “I executed 12873613 VTs before an unexpected timeout occured and the target became unresponsible”, and I expected it so much that I still believe I (beginner) must be doing something wrong. I get only the “A timeout occured” part but nothing about what happened all the other time. This is not about debugging the cause for the timeout, just about my unexperienced report expectations
Ok, thanks for your hints and info, especially the confirmation “this is not tracked in the web-interface report”. I know it might be uncommon to subject such basic device (no OS, no files, no complex web application) to OpenVAS scanning but was anyway interested in the outcome. - Kolja